
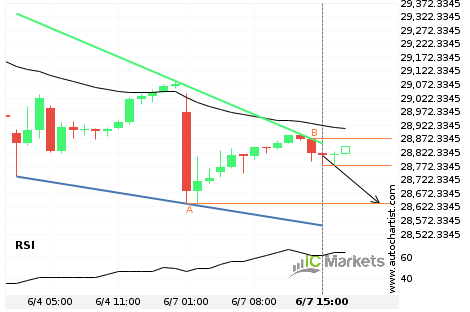
Either a rebound or a breakout imminent on Hong Kong 50 Index
Hong Kong 50 Index is heading towards the support line of a Falling Wedge. If this movement continues, we expect the price of Hong Kong 50 Index to test 28635.0000 within the next 6 hours. But don’t be so quick to trade, it has tested this line numerous times in the past, so this movement […]
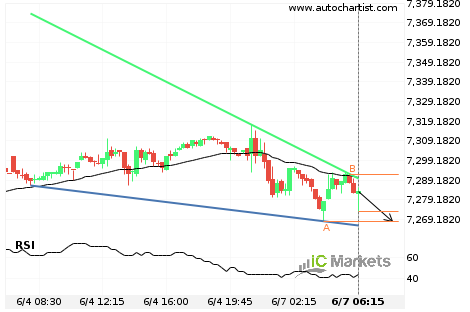
Either a rebound or a breakout imminent on Australia 200 Index
Australia 200 Index is heading towards the support line of a Falling Wedge. If this movement continues, we expect the price of Australia 200 Index to test 7268.2800 within the next 6 hours. But don’t be so quick to trade, it has tested this line numerous times in the past, so this movement could be […]
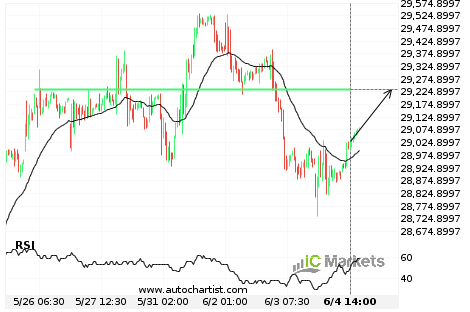
Hong Kong 50 Index approaching important 29233.5996 price line
Hong Kong 50 Index is approaching the resistance line of a Resistance. It has touched this line numerous times in the last 10 days. If it tests this line again, it should do so in the next 22 hours.

Hong Kong 50 Index approaching important 29233.5996 price line
Hong Kong 50 Index is approaching the resistance line of a Resistance. It has touched this line numerous times in the last 10 days. If it tests this line again, it should do so in the next 22 hours.
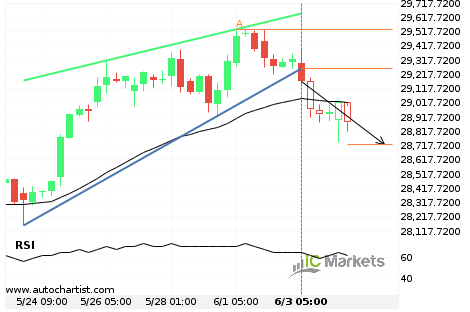
Hong Kong 50 Index has broken through support
Hong Kong 50 Index has broken through the support line of a Rising Wedge. It has touched this line at least twice in the last 11 days. This breakout indicates a potential move to 28727.0507 within the next 11 hours. Because we have seen it retrace from this positions in the past, one should wait […]
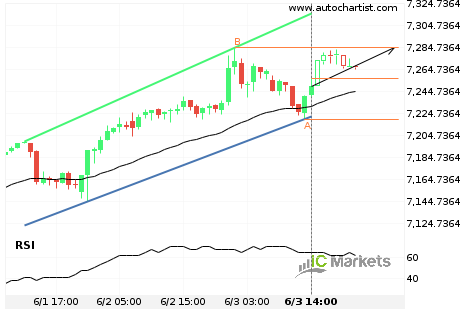
Australia 200 Index approaching resistance of a Channel Up
Australia 200 Index is approaching the resistance line of a Channel Up. It has touched this line numerous times in the last 3 days. If it tests this line again, it should do so in the next 7 hours.

Australia 200 Index approaching resistance of a Channel Up
Australia 200 Index is approaching the resistance line of a Channel Up. It has touched this line numerous times in the last 3 days. If it tests this line again, it should do so in the next 7 hours.

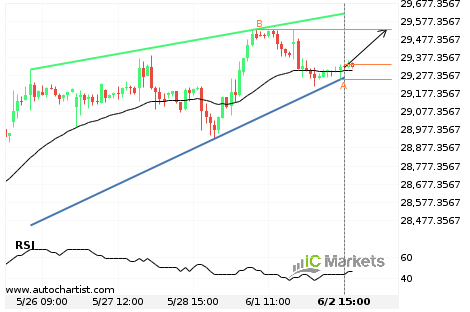
Hong Kong 50 Index – getting close to resistance of a Rising Wedge
Hong Kong 50 Index is moving towards the resistance line of a Rising Wedge. Because we have seen it retrace from this line before, we could see either a break through this line, or a rebound back to current levels. It has touched this line numerous times in the last 8 days and may test […]